Validation
It is easy to show specific examples or rules, indicators and systems that produce large profits. Many books and systems base the proof of trading method on specific examples. These examples look reasonable in isolation. Providing that a system is likely to be successful can only be done with a long-term test and disclosure of the statistical performance profile, not with a few well-chosen examples.
We are providing a full transparent and integrity framework for algorithmic trading
Training the Model
In case that the idea is confirmed from the training cycle, we have also to verify that the model is not overfitting to the dataset.
The two broad causes of overfitting are:
• small sample size, so that noise and trend are not distinguishable
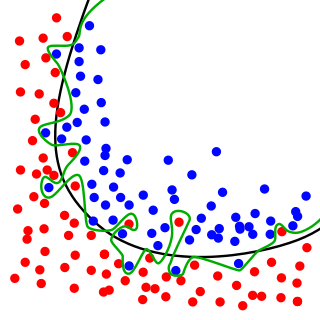
• choosing an overly complex model with multiple variables so that it ends up distorting to fit the noise in the sample

The green line represents an overfitted model and the black line represents a regularized model. While the green line best follows the training data, it is too dependent on that data and it is likely to have a higher error rate on new unseen data, compared to the black line. (Source : Wikipedia)
Signal vs Noise
In predictive modelling, the “signal” is the true underlying pattern that the model has to learn from the dataset. Instead “Noise”, refers to the irrelevant information in the dataset. When noise interferes with signal then it is quite possible that the Machine Learning algorithm will “memorise the noise” instant of finding the signal and as a result the final model will be overfitting.
In case that the predictive model is a very complex with many rules and parameters then the overfitting is quite possible.
Performance criteria
Sharpe ratio. Measures the performance of an investment compared to a risk-free asset (usually the interest rate of 90-days Treasury bill), after adjusting for its risk. It is defined as the difference between the returns of the investment and the risk-free return, divided by the standard deviation of the investment.
Profit factor. It is the profits divided by losses. Our norm is that the profit factor must be at least 1.80, otherwise the trading strategy is rejected.
Standard Deviation and Skewness distribution measures for the daily returns. We always calculate the performance in comparison with the risk we are taking.
Number of trades. Indicates whether the validation process was long enough to generate dependable results.
Percentage of profitable trades. Our norm is that the percentage of profitable trades must be above 50%
Daily rate of Returns. The rate of daily returns is the percentage of increasing or decreasing over the initial investment
Maximum drawdown. The maximum observed loss from a peak to a trough of a strategy, before a new peak is attained.
Annualized rate of returns. Are returns over a period scaled to a 12-month period.
Time in market. An algorithmic trading model that is in the market less than another model is preferable, taking in the consideration the profitability and the risk.
Positive Days. The total number of days during an annual period that the investment capital is increasing. Our norm for each strategy is that the rate must be above 70%
Benchmark with S&P 500 Index. Our strategies have as a norm to beat the S&P 500 yearly performance in 100% percentage, at least.